Android Studio Tour
Android Studio is the official Integrated Development Environment (IDE) for Android application development, based on IntelliJ IDEA. On top of IntelliJ's powerful code editor and developer tools, Android Studio offers even more features that enhance your productivity when building Android apps, such as a flexible Gradle-based build system, a fast and feature-rich emulator, and a unified environment where you can develop for all Android devices. Here's a detailed tour of the Android Studio interface to help you navigate and utilize its features effectively.
As you read through this tour open the Android application and follow along.
Getting Started with Android Studio
When you first launch Android Studio, the welcome screen presents several options:
- Start a new Android Studio project: Begin coding a new app from scratch.
- Open an existing Android Studio project: Open a project you've previously worked on.
- Check out project from Version Control: Clone a project from a Git repository.
- Configure: Access settings, check for updates, install plugins, and more.
Main Window
After opening or creating a project, you'll see the main window divided into several areas:
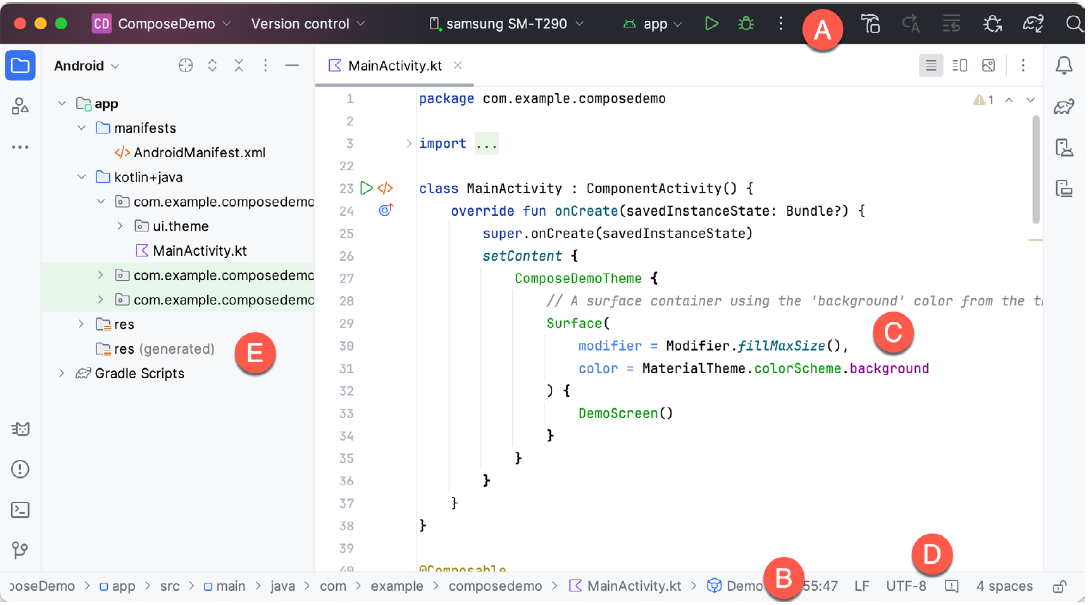
A. Toolbar
At the top, the toolbar provides quick access to run and debug tools, apply changes to the running app, AVD Manager (Android Virtual Device), and more. It includes:
- Run/Debug configurations: Dropdown to select the device or the emulator you want to run your app on.
- Run app: Button to compile and run your application on the selected device.
- Debug app: Start debugging your application.
- Apply Changes and Restart Activity: Quickly reload changes in the active activity without restarting the entire app.
B. Navigation Bar
Right below the toolbar, the navigation bar allows you to quickly navigate the structure of your project and open files for editing.
C. Editor Window
This is the central area where you code. It provides tabs for open files, code linting, syntax highlighting, and intelligent code completion.
D. Status Bar
At the very bottom, the status bar shows the status of your project and IDE, like the current branch you're working on, memory usage, and any background processes.
E. Project Window
On the left side, this window shows a hierarchical view of the components in your project, including:
Tool Windows
Various tools can be accessed from the buttons on the right, bottom, and left sides of the main window:
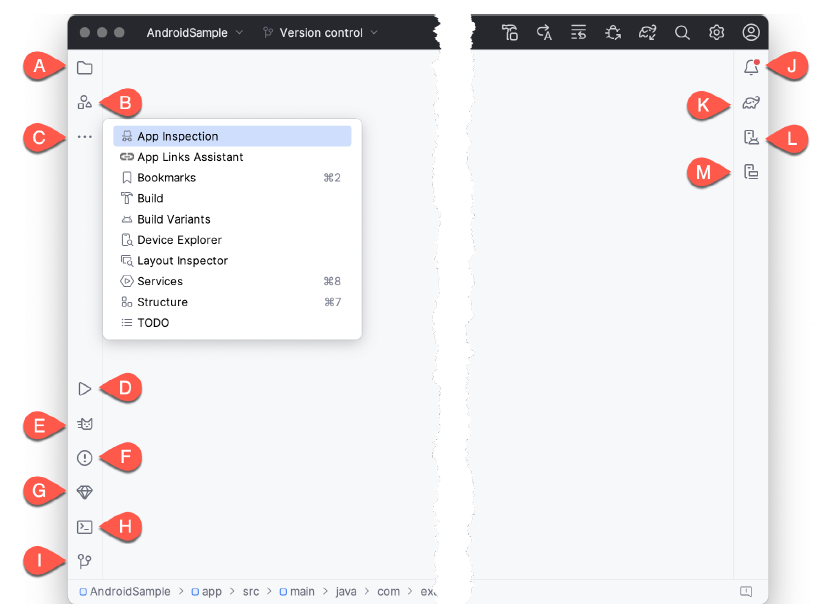
- A. Project View - The project view provides an overview of the file structure that makes up the project allowing for quick navigation between files. Generally, double-clicking on a file in the project view will cause that file to be loaded into the appropriate editing tool.
- B. Resource Manager - A tool for adding and managing resources and assets within the project, such as images, colors, and layout files.
- C. More Tool Windows - Displays a menu containing additional tool windows not currently displayed in a tool window bar. When a tool window is selected from this menu, it will appear as a button in a tool window bar.
- App Inspection - Provides access to the Database and Background Task inspectors. The Database Inspector allows you to inspect, query, and modify your app’s databases while running. The Background Task Inspector allows background worker tasks created using WorkManager to be monitored and managed.
- Bookmarks – The Bookmarks tool window provides quick access to bookmarked files and code lines. For example, right-clicking on a file in the project view allows access to an Add to Bookmarks menu option. Similarly, you can bookmark a line of code in a source file by moving the cursor to that line and pressing the F11 key (F3 on macOS). All bookmarked items can be accessed through this tool window.
- Build - The build tool window displays information about the build process while a project is being compiled and packaged and details of any errors encountered.
- Build Variants – The build variants tool window provides a quick way to configure different build targets for the current application project (for example, different builds for debugging and release versions of the application or multiple builds to target different device categories).
- Device File Explorer – Available via the View -> Tool Windows -> Device File Explorer menu, this tool window provides direct access to the filesystem of the currently connected Android device or emulator, allowing the filesystem to be browsed and files copied to the local filesystem.
- Layout Inspector - Provides a visual 3D rendering of the hierarchy of components that make up a user interface layout.
- Structure – The structure tool provides a high-level view of the structure of the source file currently displayed in the editor. This information includes a list of items such as classes, methods, and variables in the file.
- TODO – As the name suggests, this tool provides a place to review items that have yet to be completed on the project. Android Studio compiles this list by scanning the source files that make up the project to look for comments that match specified TODO patterns. These patterns can be reviewed and changed by opening the Settings dialog and navigating to the TODO entry listed under Editor.
- D. Run – The run tool window becomes available when an application is currently running and provides a view of the results of the run together with options to stop or restart a running process. If an application fails to install and run on a device or emulator, this window typically provides diagnostic information about the problem.
- E. Logcat – The Logcat tool window provides access to the monitoring log output from a running application and options for taking screenshots and videos of the application and stopping and restarting a process.
- F. Problems - A central location to view all of the current errors or warnings within the project. Doubleclicking on an item in the problem list will take you to the problem file and location.
- G. App Quality Insights- Provides access to the cloud-based Firebase app quality and crash analytics platform.
- H. Terminal – Provides access to a terminal window on the system on which Android Studio is running. On Windows systems, this is the Command Prompt interface, while on Linux and macOS systems, this takes the form of a Terminal prompt.
- I. Version Control - This tool window is used when the project files are under source code version control, allowing access to Git repositories and code change history.
- J. Notifications - This tool window is used when the project files are under source code version control, allowing access to Git repositories and code change history.
- K. Gradle – The Gradle tool window provides a view of the Gradle tasks that make up the project build configuration. The window lists the tasks involved in compiling the various elements of the project into an executable application. Right-click on a top-level Gradle task and select the Open Gradle Config menu option to load the Gradle build file for the current project into the editor. Gradle will be covered in greater detail later in this book.
- L. Device Manager - Provides access to the Device Manager tool window where physical Android device connections and emulators may be added, removed, and managed.
- M. Running Devices - Contains the AVD emulator if the option has been enabled to run the emulator in a tool window
Compose Editor
When you open a kotlin file which it written to use composeables, you have the option of opening a preview window to see the application. In the Starter Application that is given at the end of chapter 1. The following block of code has been provided to allow the preview to work
@Preview(showBackground = true, showSystemUi = true)
    @Composable
    fun helloClassPreview(){
        helloClass() // Show the same UI as the main function
    }
The @Preview annotation includes two settings:
showBackground = true– Adds a background color to the preview so the UI elements are easier to see.showSystemUi = true– Displays system elements like the status bar and navigation bar to make the preview look like a real device.
Inside the function, the helloClass() is applied, which wraps the UI in the app's defined visual style (colors, typography, etc.). The helloClass() composable is the actual screen or component being previewed.
When you have the MainActivity.kt file open if you click the split icon ![]() or
or ![]() in the top right corner the preview screen will appear. The screenshot below shows what it looks like using the split screen.
in the top right corner the preview screen will appear. The screenshot below shows what it looks like using the split screen.
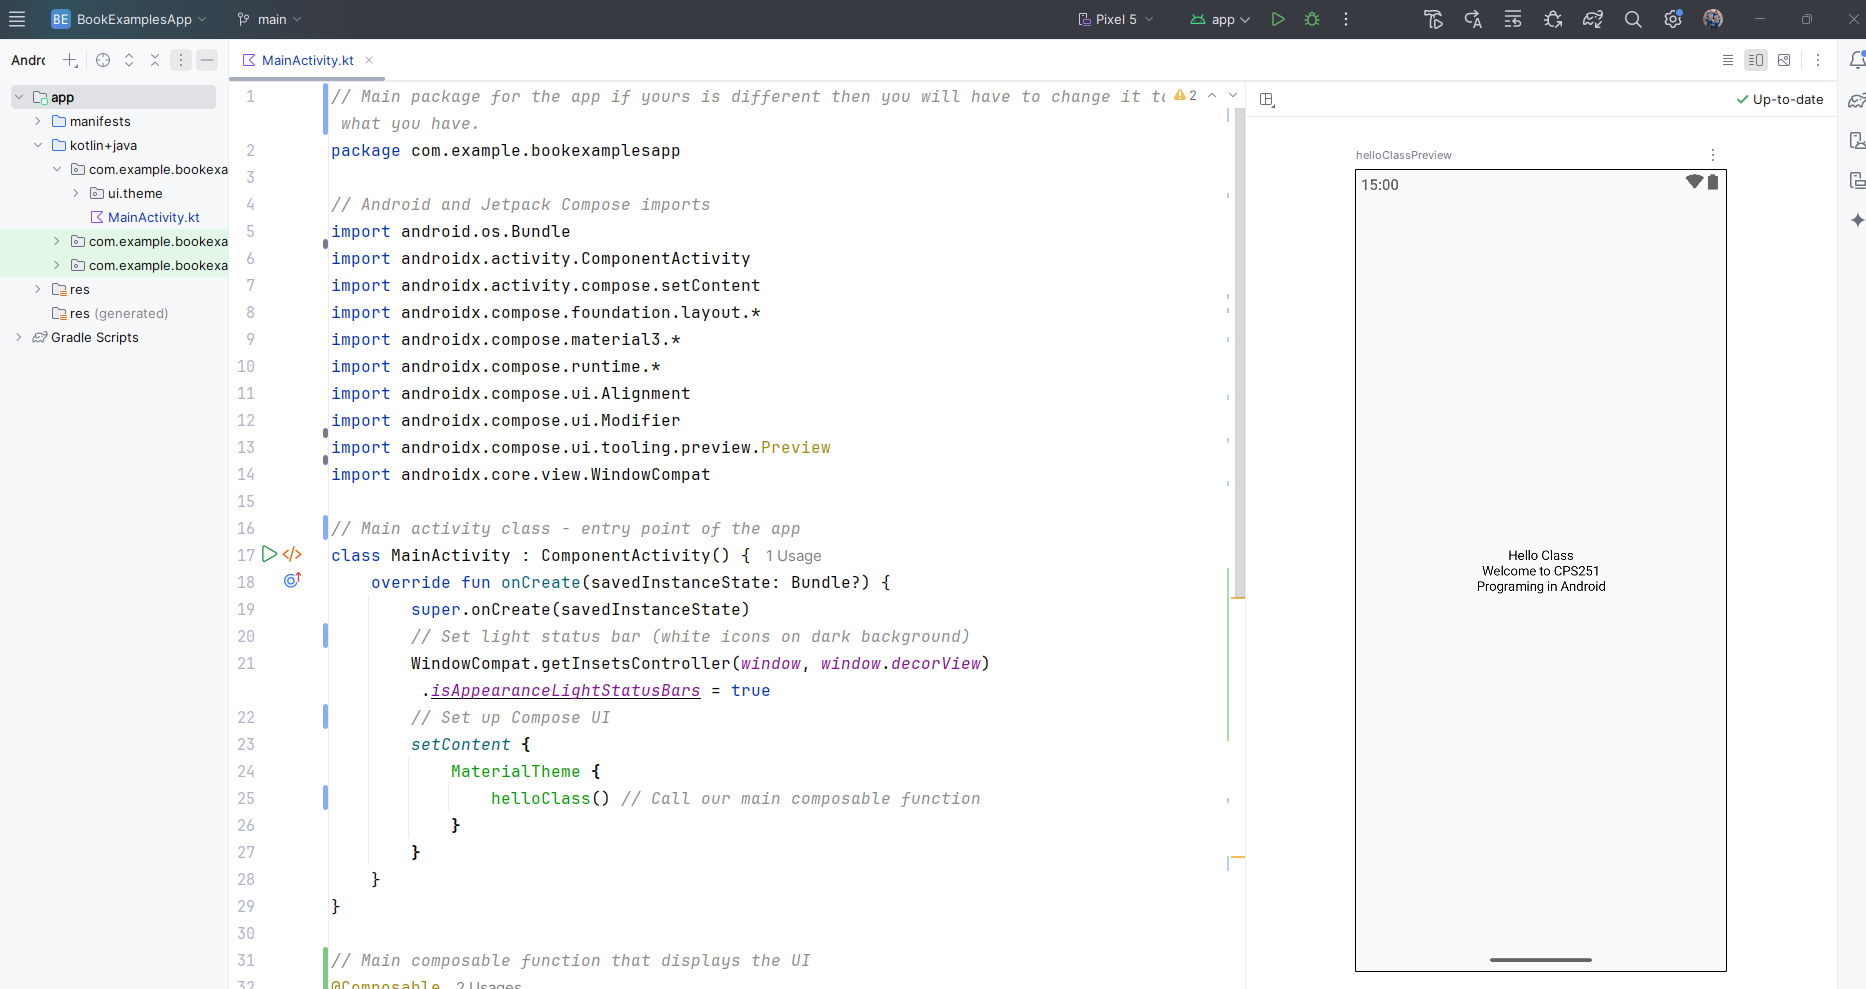
When you first start it you will have to engage the preview and you do that by clicking the link that states something like "Build & Refresh...". In some cases you will have to engage it first which means you will have to click a link inside the preview box that will say something like "Click here to build and refresh". This preview is very useful if you want to be able to view your app screen as you write it. It will update it in real time as you write your code. If it doesn't you can always just click the part in the upper left stating something like "Click here to update".
A really nice feature of the previews you can also put it into interactive mode where you can test your project out to see if it's working there are some limitations however.
- Interactive mode only works with Composable functions. It can't test things like navigation, background services, camera, or location access.
- State resets every time you restart interactive mode. Any changes you make (like clicking buttons or entering text) won't be saved when it's refreshed.
- Some animations and lifecycle-aware components might not work correctly.
- It doesn't have access to full app resources or dependencies like ViewModels, databases, or network data unless you set up mock data or preview-specific content.
- Interactive mode can sometimes be slow or crash, especially with complex UIs or unsupported features.